
Pandas is one of my favorite libraries in python. It’s very useful to visualize the data in a clean structural manner. Nowadays Pandas is widely used in Data Science, Machine Learning and other areas. The functionality of Pandas cannot be covered by any other libraries so far. In this post, I’ll cover some mainly used functionalities and tricks in Pandas..
To start working with Pandas, Import the package pandas. The standard way to import pandas is using the convention pd.
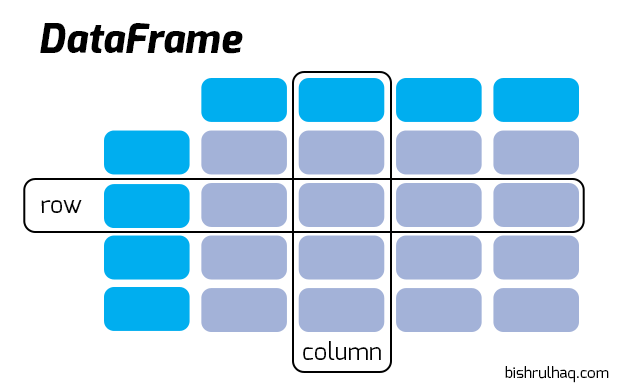
import pandas as pdDataFrame in Pandas
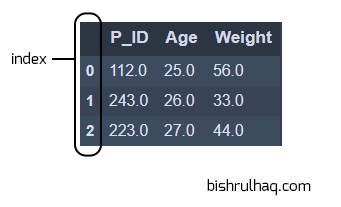
A DataFrame is similar to a Table. Whereas, It’s represented in Rows and Columns with 2-dimensional data structure as seen below.
Now , Let’s create a 2-Dimensional Data Structure using Pandas.
import pandas as pd
import numpy as np

# Creating a dictionary with the keys and their values
data = {
'Name': ['Bishul Haq', 'Jhon Green', 'Siva', 'Malik', 'Silva', 'Joseph', 'katie', 'Naruto', 'Seth', 'Penny'],
'Age': [25, 26, 27, 25, 24, 23, 22, 21, 20, 19],
'Country': ['Sri Lanka', 'United Kingdom', 'India', 'Jordan', 'Brazil', 'Pakistan', 'U.S.A', 'Japan', 'China', 'Italy']
}

# DataFrame
df = pd.DataFrame(data, columns=['Name','Age','Country'])
Using head and tail to view the DataFrame
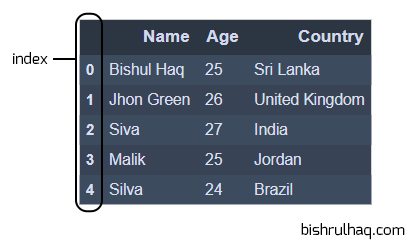
To view the DataFrame object, You can use head() and tail() method. By default it comes with 5 elements to display, you can also pass a custom number to see the selected number of data.
df.head()Output :
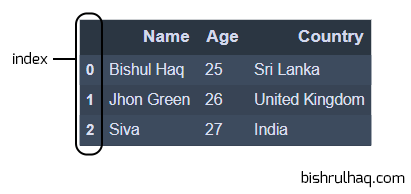
If you want to see the first three elements, then you can pass number three to see the data as shown below.
df.head(3)Output :
To check the last three elements in the DataFrame. You can use the method tail() with the number three to see the data as,
df.tail(3)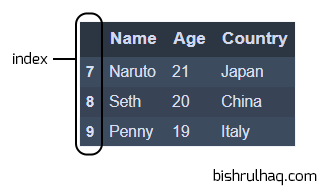
Opening Data files
Pandas provides different methods to read variety of data in different formats,
# To read a CSV file
pd.read_csv('name_of_the_file')

# To read a Encoded CSV file
pd.read_csv('name_of_the_file', encoding = 'ISO-8859-1')

# To read a delimited text file (like TSV)
pd.read_table('name_of_the_file')

# To read an Excel file
pd.read_excel('name_of_the_file')

# To read a JSON file.
pd.read_json('name_of_the_json_file')

# To read an html URL, string or file to extract tables for a list of dataframes
pd.read_html('url')

# To read contents of your clipboard
pd.read_clipboard()
Writing Data Files
You can export the DataFrame to different file formats such as CSV, SQL, JSON and .xlsx (Excel File).
#To Write the DataFrame into CSV file
pd.to_csv('name_of_the_file_to_save')

#To Write the DataFrame into Excel file
df.to_excel('name_of_the_file_to_save')

#To Write the DataFrame into SQL table
df.to_sql('name_of_the_table', 'connection_object')

#To Write the DataFrame into JSON file
df.to_json('name_of_the_file_to_save')
Knowing some Useful Info of the DataFrame
There are some methods which are exclusively useful to check relevant information about the DataFrame.
# Rows and Columns in the DataFrame
df.shape

# Description of Index
df.index

# Columns in the DataFrame
df.columns

# Count and Unique values for columns
df.apply(pd.Series.value_counts)

# Data Counts which are not-null
df.count()

# Summary for numerical columns
df.describe()

# Mean Value of all columns
df.mean()

# Correlation between columns
df.corr()

# highest value in each column
df.max()

# lowest value in each column
df.min()

# median of each column
df.median()

# standard deviation of each column
df.std()
Checking missing values in a DataFrame
To check the null values in python we use isnull(), notnull() functions to check null and not null values which will return as True or False.
import pandas as pd
import numpy as np

# Creating a dictionary with the keys and their values
data = {
'Name': ['Bishul Haq', 'Jhon Green', np.nan, 'Malik', 'Silva', 'Joseph', 'katie', np.nan, 'Seth', 'Penny'],
'Age': [25, 26, 27, 25, 24, 23, 22, 21, 20, np.nan],
'Country': ['Sri Lanka', np.nan, 'India', 'Jordan', 'Brazil', 'Pakistan', 'U.S.A', 'Japan', np.nan, 'Italy']
}

# DataFrame
df = pd.DataFrame(data, columns=['Name','Age','Country'])
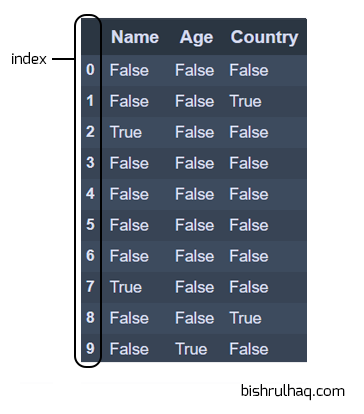
# using isnull() function to check the null values
df.isnull()
Output :
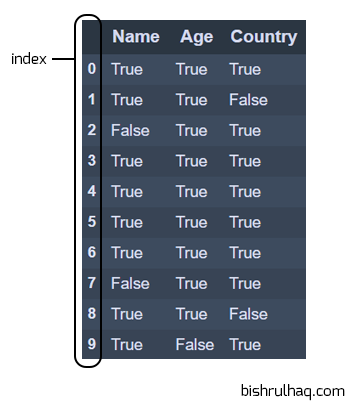
# using notnull() function to check the values which are not null
df.notnull()
Output :
Filling missing values in a DataFrame
Sometimes there may not be any value presented in the datasets. In Pandas missing data is represented in two ways.
- NaN : NaN (Not a Number), It is a special floating-point value and cannot be converted to any other type than float.
- None: It represents the missing data in python code.
Hence, Pandas recognise None and NaN as missing or null values. We use several functions like fillna() and replace() to fill the null values in a DataFrame.
import pandas as pd
import numpy as np
# Creating a dictionary with the keys and their values
data = {
'P_ID': [112,243,223,225,np.nan],
'Age': [25, 26, 27, np.nan,23],
'Weight': [56,33,44,55,np.nan]
}
# DataFrame
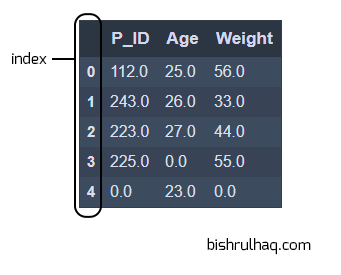
df = pd.DataFrame(data, columns=['P_ID','Age','Weight'])# filling missing value using fillna()
df.fillna(0)Output :
Some other common ways to fill the missing values using fillna() function.
# filing a missing value with previous values
df.fillna(method ='pad')

# filling  null value using fillna() function
df.fillna(method ='bfill')
Filling values with -99 value using replace() function.
# Replace  Nan value with value -99
df.replace(to_replace = np.nan, value = -99)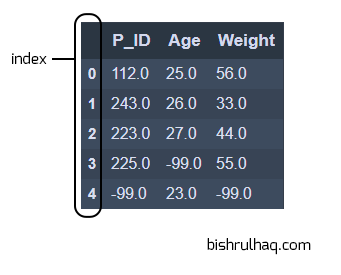
Dropping missing values in a DataFrame
To delete the null values from the DataFrame. We use the dropna() function, which will drop the Columns or Rows with null values.
import pandas as pd
import numpy as np

# Creating a dictionary with the keys and their values
data = {
'P_ID': [112,243,223,225,np.nan],
'Age': [25, 26, 27, np.nan,23],
'Weight': [56,33,44,55,np.nan]
}

# DataFrame
df = pd.DataFrame(data, columns=['P_ID','Age','Weight'])
# using dropna() function to drop the null values
df.dropna() Output :
Some other functionalities of dropna() to drop the missing values.
# Drop a columns which have at least 1 missing values
df.dropna(axis = 1)

# Making new DataFrame with dropped missing values
new_df = df.dropna(axis = 0, how ='any')

# Drop rows where all data is missing
df.dropna(how = 'all')
Droping Columns and Rows
# Removing rows by index value
s.drop([0, 1])

#Remove columns Age
df.drop('Age', axis = 1)
Data Selection in a DataFrame
We can select a subset or position or an index of Data in a DataFrame using several functions like iloc, loc.
# Select by passing the column label
df[col]

# Select by passing columns as a new DataFrame
df[[col1, col2]]

# Select by position
df.iloc[0]

# Select by Index
s.loc['index_one']

# Select by first row
df.iloc[0,:]

# Select the first element of first column
df.iloc[0,0]
Combining Data in a DataFrame
To combine multiple DataFrame into single DataFrame. We can use append() , merge() , join() and concat() functions.
- Merge: To combine Data on common column or indices.
- Join: to combine Data on Key column or index.
- Concat: To combine DataFrames across rows or columns
# Add df1 to the end of df2 (columns should be identical)
df1.append(df2)

# Add the columns in df1 to the end of df2 (rows should be identical)
pd.concat([df1, df2],axis=1)

# Join the columns in df1 with the columns on df2 (rows should be identical) with 'left', 'right', 'outer', 'inner' join.
df1.join(df2,on=col1,how='inner')

# Merging df1 and df2 DataFrames
merged_df = pd.merge(df1, df2)
Hope you have gone through the tricks and features of Pandas 😊. If you like this please share with others and drop your ideas and suggestions at the comment section.
Practice on the go
Learn Python, the free Android app
Every topic in this series lives in the app too: bite-size lessons, runnable examples, quizzes, mini projects, and an offline Python playground that runs on your phone.


Comments
0No comments yet. Be the first to share your thoughts.